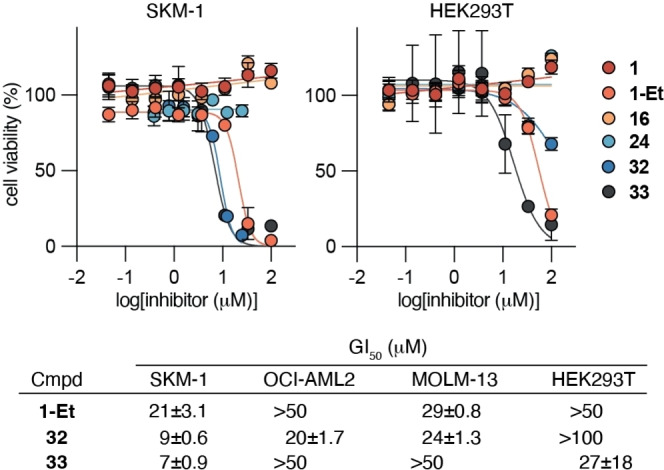
Figure 6.

Cell viability upon treatment with 1, 1‐Et, 16, 24, 32, and 33. Dose–response curves from cell viability assays of the selected compounds against cultured SKM‐1 (SIRT5‐dependent acute myeloid leukemia) cells and HEK293T (immortalized, non‐malignant human embryonic kidney) cells as well as GI50 values of 1‐Et, 32, and 33 against OCI‐AML2, MOLM‐13 (SIRT5‐dependent acute myeloid leukemia) cells. All values represent data from three individual assays performed in duplicate (see the Supporting Information Figure S9 for additional dose–response curves).
