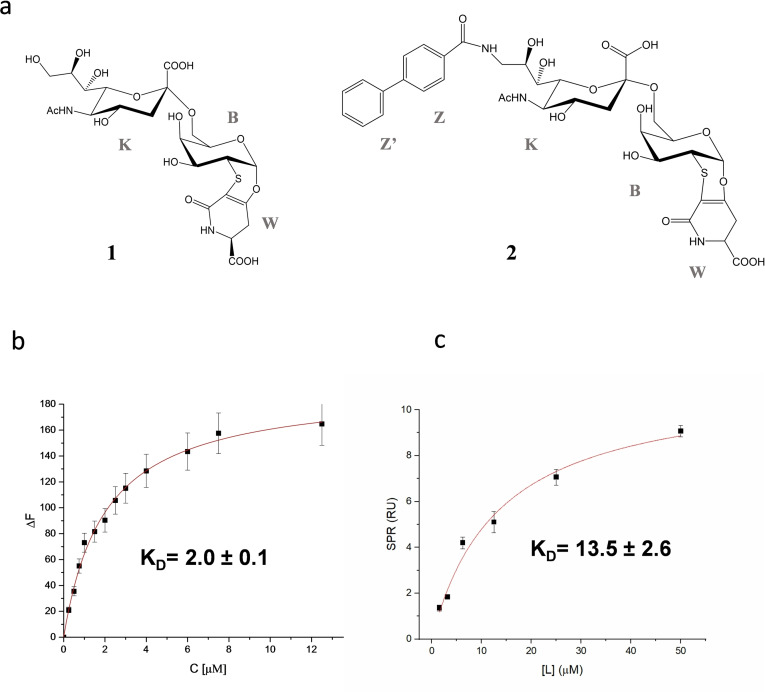
Figure 1.
Binding affinity of h‐CD22 and sialic acid analogues. a) Structures of the sialic acid analogues used in this study. b) Fluorescence titration of h‐CD22 upon the addition of analogue 1. Each emission spectrum was recorded at the excitation wavelength of 285 nm and a temperature of 10 °C. The relative binding isotherm and the value of the dissociation constant (KD) is reported. For each data point, 10 % Y error bars are shown. c) SPR binding curve for analogue 2 vs h‐CD22 on Protein A. Each point is representative of 3 replicates (RUmean±SD).

