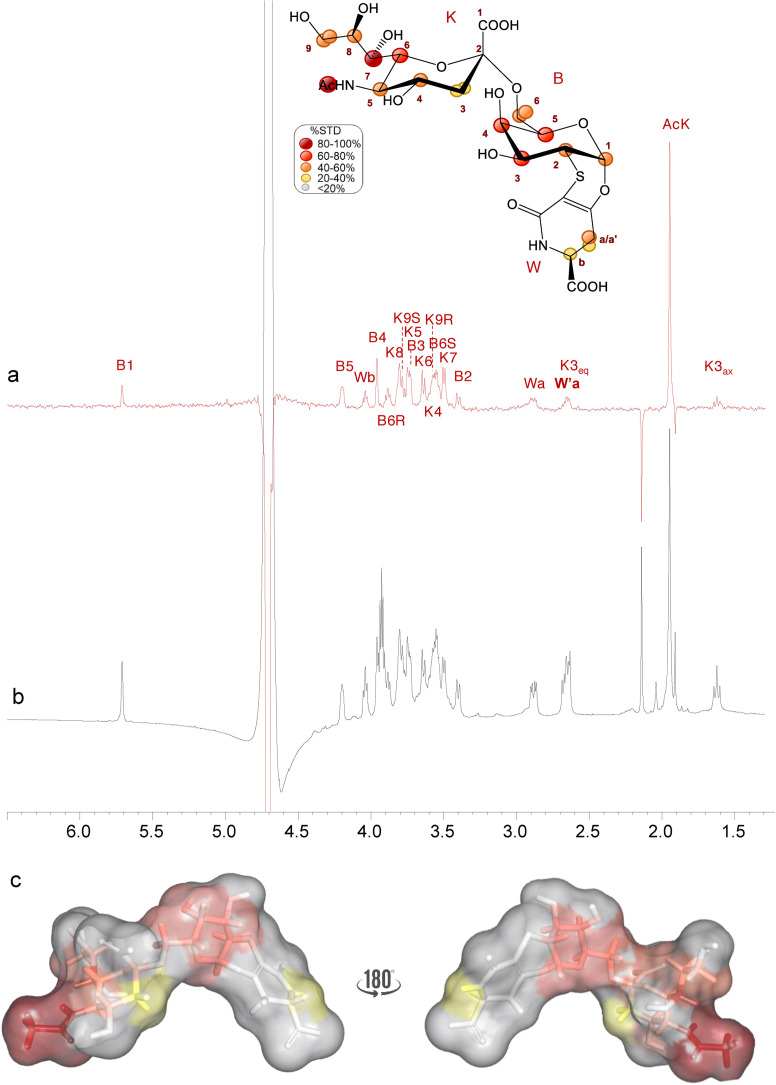
Figure 2.
STD NMR analysis of analogue 1 in the interaction with h‐CD22. Superimposition of the STD NMR spectrum (a) and the 1H NMR spectrum (b) of h‐CD22/analogue 1 mixture with a molecular ratio of 1 : 100, at 298 K. The interacting epitope map of analogue 1 as derived by STD‐NMR data is also reported. c) 3D representation of the analogue 1 in the bioactive conformation obtained by tr‐NOESY with molecular surface colored according to STD enhancements.

