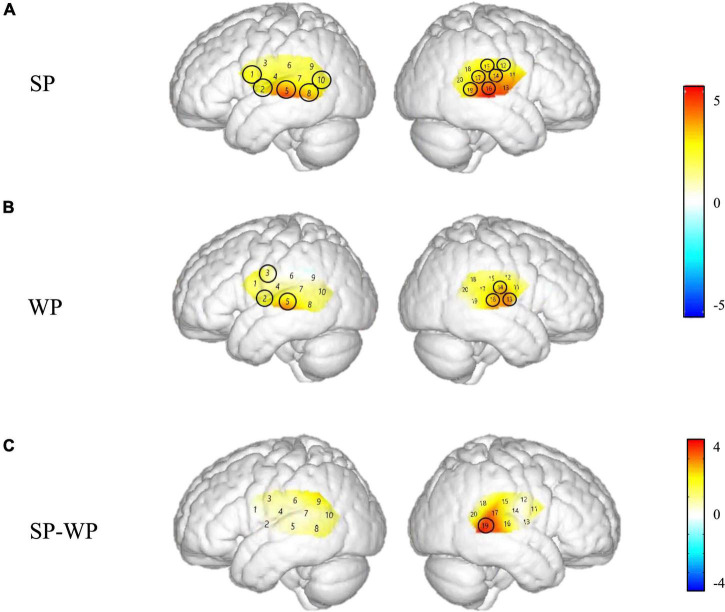
FIGURE 4.
Cortical activation maps of the normal hearing (NH) group on the normalized brain surface. The color scales represent the T values, with statistically significant activated channels circled in black [pFRD–cor < 0.05]. (A,B) Lateral views of significantly activated channels under strong-prosodic (SP) and weak-prosodic (WP) conditions contrasted against silence, respectively. (C) Lateral views of significantly activated channels by contrasting between conditions, indicating the stronger activated neural areas driven by the SP features in SP sentences.

