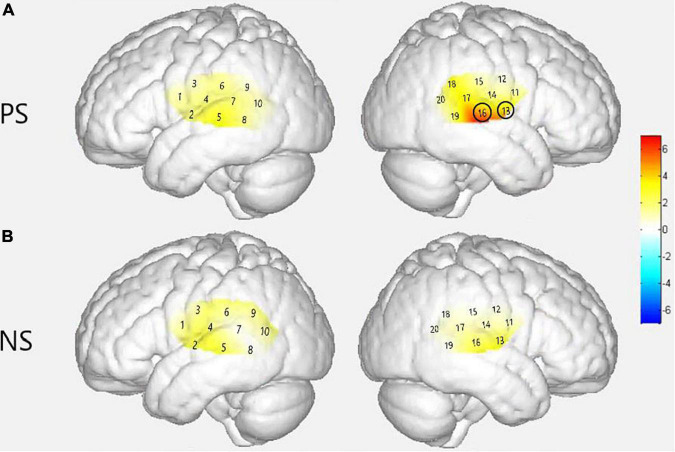
FIGURE 6.
Group level cortical activation maps by contrasting between groups in the views of the normalized brain surface. The color scales represent the F values, with statistically significant activated channels circled in black [pFRD–cor < 0.05]. (A) Lateral views of significantly activated channels in normal hearing (NH) group under the strong-prosodic (SP) condition than CI. (B) Lateral views of activating difference under the weak-prosodic (WP) condition by contrasting two groups of participants.

