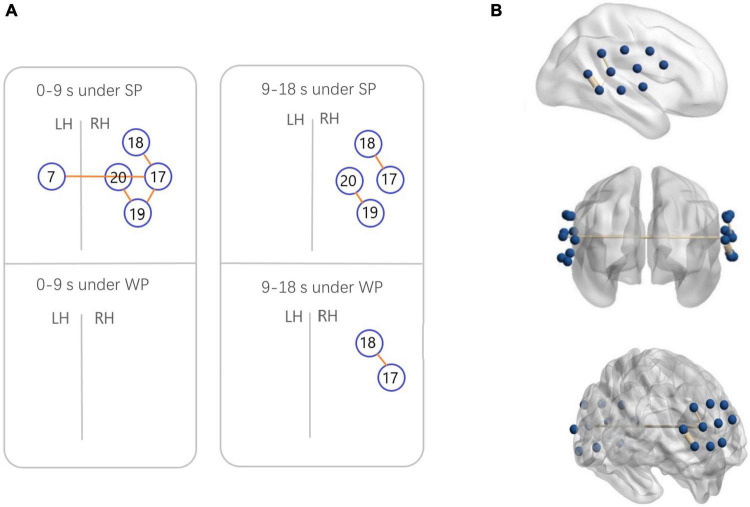
FIGURE 7.
Functional connectivity (FC) maps among the activated cortical regions in the normal hearing (NH) group. (A) Blue circles indicate channels, and the orange lines show correlations greater than 0.6 (average across all participants). A significant correlation was found in Ch7-17 [r = 0.6231], Ch17-18 [r = 0.6222], Ch17-19 [r = 0.6194], and Ch19-20 [r = 0.6304] under strong-prosodic (SP) condition in time-window of 0–9 s. Under SP condition in time-windows of 9–18 s, significant correlation was found in Ch17-18 [r = 0.6561], Ch19-20 [r = 0.6088]. Correlation under weak-prosodic (WP) condition in time windows of 9–18 s was found in Ch17-18 [r = 0.6215]. (B) FC in the NH group under SP condition on the standard brain in time-windows of 0–9 s in different views. The blue dots indicate 20 channels, and the yellow lines show correlations greater than 0.6 (average across all participants).

