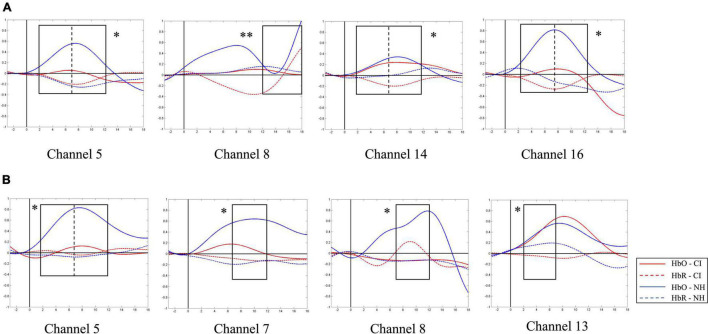
FIGURE 9.
Between-group contrast of average oxygen-hemoglobin concentrations (HbO) envelopes under strong-prosodic (SP) and weak-prosodic (WP) conditions. (A) Hemodynamic responses to SP by both groups in channels 5, 8, 14, and 16. Higher activation by normal hearing (NH) group was found in time window 2–7 s in Ch5 [F(1,44) = 5.186, pFRD–cor = 0.028], Ch14 [F(1,44) = 9.367, pFRD–cor = 0.004], and Ch16 [F(1,44) = 10.162, pFRD–cor = 0.003]; time window 7–12 s in Ch5 [F(1,44) = 5.084, pFRD–cor = 0.029], Ch14 [F(1,44) = 9.736, pFRD–cor = 0.003], and Ch16 [F(1,44) = 11.506, pFRD–cor = 0.001]; and time window 12–18 s in Ch8 [F(1,44) = 8.994, pFRD–cor = 0.004]. (B) Under WP, higher activation by NH group was found in time window 2–7 s in Ch5 [F(1,44) = 5.743, pFRD–cor = 0.021], Ch13 [F(1,44) = 5.185, pFRD–cor = 0.028]; and time window 7–12 s in Ch5 [F(1,44) = 4.483, pFRD–cor = 0.04], Ch7 [F(1,44) = 5.932, pFRD–cor = 0.019], and Ch8 [F(1,44) = 6.606, pFRD–cor = 0.014].

