
FIGURE 3.
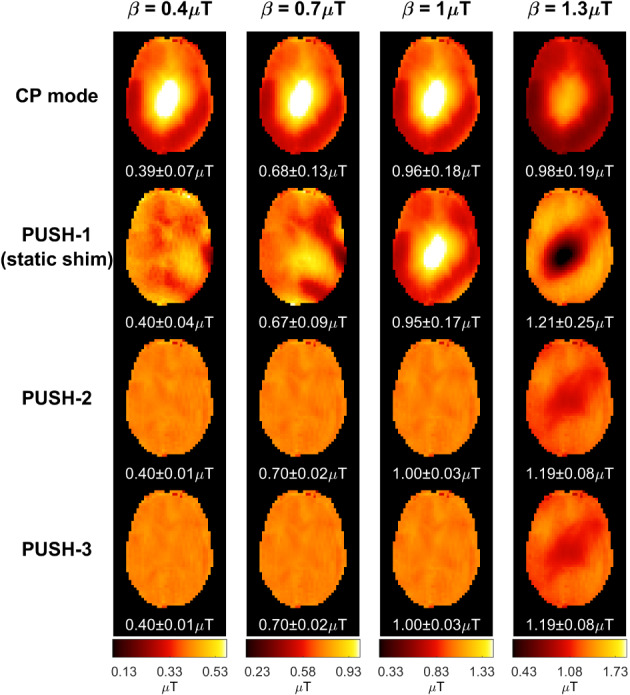
2D maps for some solutions in Figure 2. Columns contain maps for different , increasing from left to right. Rows contain different saturation pulses: CP mode (top), PUSH‐1—that is, static shimming—(second from top), PUSH‐2 (second from bottom) and PUSH‐3 (bottom). For each combination, the mean ± SD of is shown below the respective maps