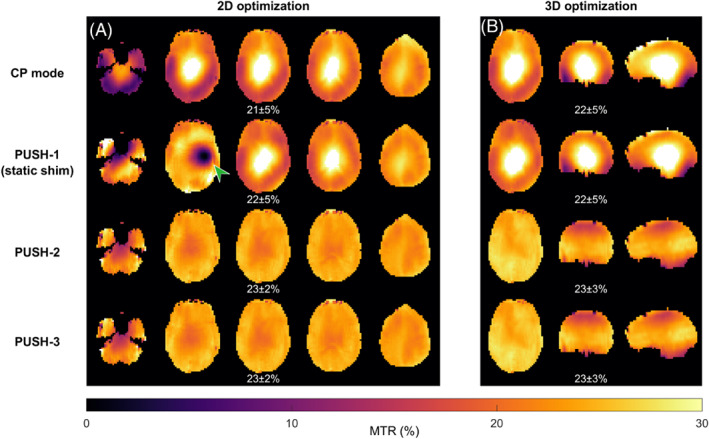
FIGURE 5.

Simulated 2D (A) and 3D (B) MTR maps using solutions (CP mode, PUSH‐1, PUSH‐2, and PUSH‐3) from Figure 2 for = as the saturation pulses. For 2D slices 6, 10, 12 (slice in Figure 3), 14, and 18 (from left to right) that were individually optimized are shown. (A) The green arrow points to a contrast “hole” seen in some slices optimized with PUSH‐1. The mean ± SD of MTR over the whole volume is shown below the respective maps
