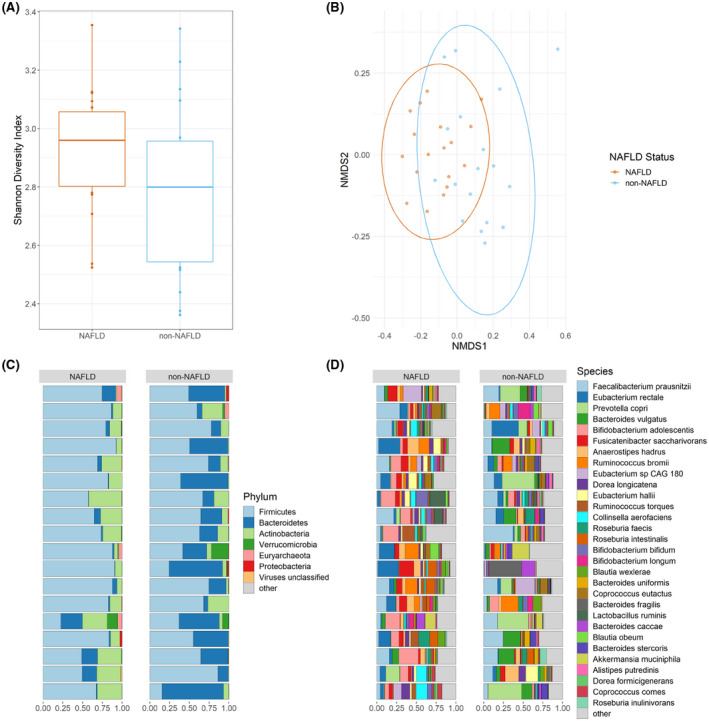
FIGURE 1.

Microbiomes of 36 obese youths. (A) Shannon alpha diversity values are displayed as boxplots with median, interquartile range, and outliers marked. (B) Bray‐Curtis nonmetric multidimensional scaling (NMDS) plot calculated at the species level using rarefied data. Phylum‐level (C) and species‐level (D) compositional bar plots are displayed with each horizontal bar representing an individual microbial community. Nonalcoholic fatty liver disease (NAFLD) status is indicated above each column of bar plots. “Other” indicates all remaining taxa are grouped within this category
