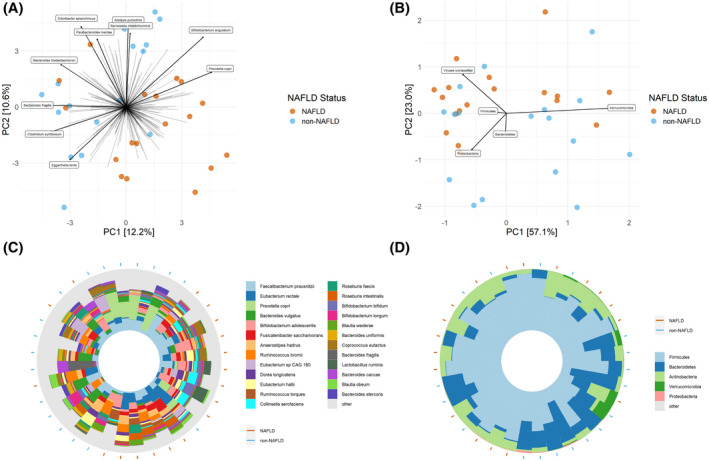
FIGURE 2.

Principal component analysis (PCA) biplots with taxa vectors and iris plots. (A) Species‐level PCA biplot with arrows indicating the abundance gradient for a particular species. The top 10 taxa variable contributors to the principal coordinates (PCs) are shown. (B) Phylum‐level PCA biplot with arrows indicating the abundance gradient for a particular phylum. The top 5 taxa variable contributors to the PCs are shown. (C) Species‐level iris plot showing the taxonomic composition of each sample with its position corresponding to its position in the associated biplot (above). The top 25 species are shown, and all remaining species are grouped into the “other” category. (D) Phylum‐level iris plot showing the taxonomic composition of each sample with its position corresponding to its position in the associated biplot (above). Orange circles on the periphery of the iris plots indicate individuals with NAFLD; blue circles indicate individuals without NAFLD individuals. Genera had to appear in 25% of samples to be included
