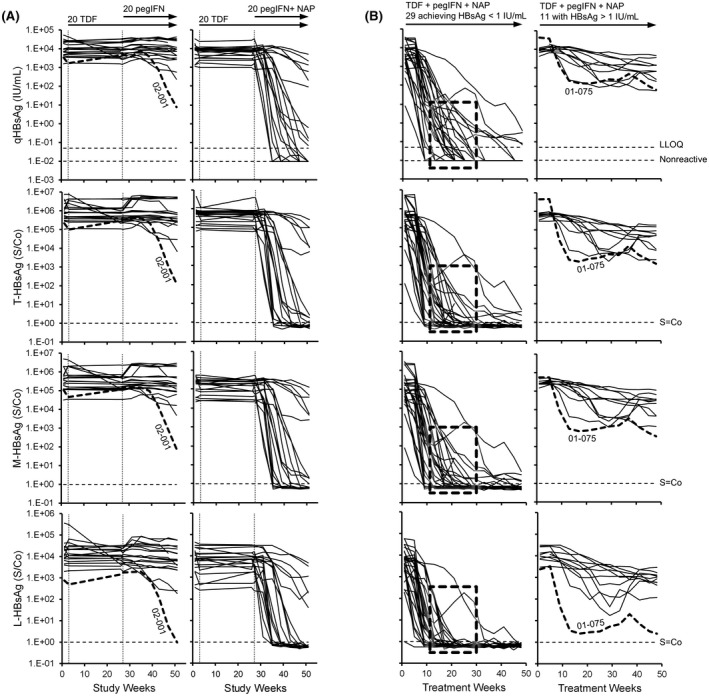
FIGURE 4.

Individual participant dynamics of T‐HBsAg, M‐HBsAg, and L‐HBsAg isoforms during therapy in the REP 401 study. (A,B) Dynamics during the initial 48 weeks of therapy in control and experimental groups (A) and during 48 weeks of TDF + pegIFN + NAP therapy (B). Dashed boxes in (B) highlight the more efficient clearance of L‐HBsAg during therapy in participants achieving qHBsAg < 1 IU/ml during therapy. Isoform composition at the end of REP 3139‐Ca monotherapy. The 2 participants in whom clearance of L‐HBsAg appeared more efficient (01‐075 and 02‐001) are highlighted in bold. The qHBsAg data were previously published[ 38 ]. TDF, tenofovir disoproxil fumarate
