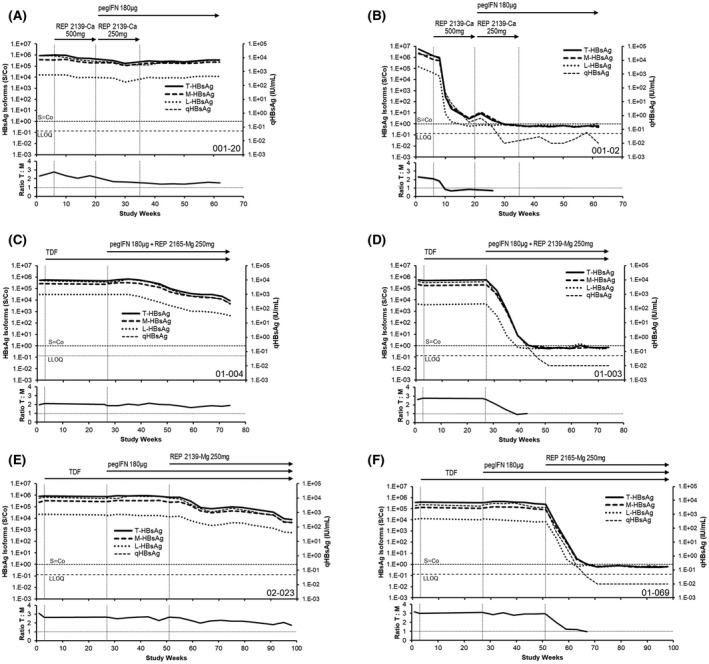
FIGURE 6.

Selective decline of HBsAg (S‐HBsAg) during NAP‐based combination therapy. Representative examples of nonselective (A,C,E) and selective (B,D,F) S‐HBsAg response in the REP 301 and REP 401 studies (see Methods) are provided. Individual T‐HBsAg, M‐HBsAg, and S‐HBsAg and qHBsAg responses are provided at the top of each panel and changes in the T‐HBsAg–to–M‐HBsAg ratio during therapy are indicated in the bottom of each panel. The qHBsAg data was previously published.[ 33 , 38 ] The serum sample cutoff (S/Co) is indicated for HBsAg isoform assays, and LLOQ (0.05 IU/ml) is indicated for the qHBsAg assay
