
FIGURE 2.
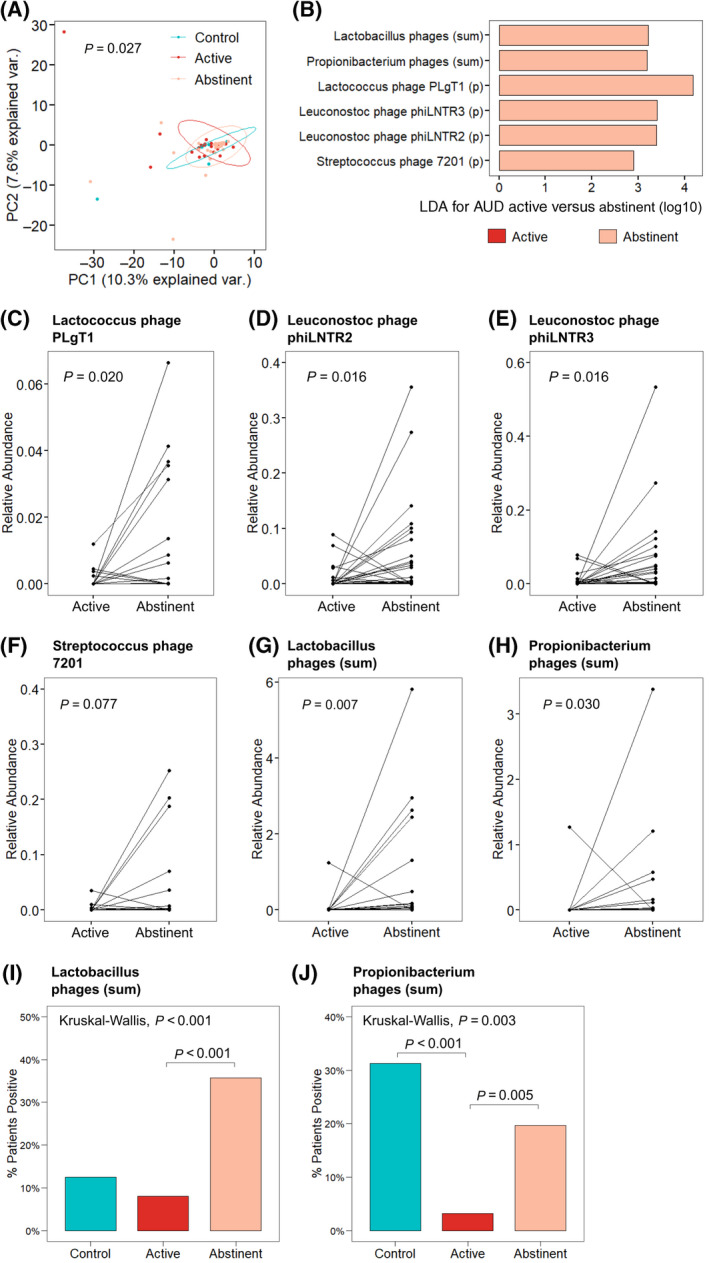
Abstinence from alcohol use changes the composition of the fecal virome in patients with AUD. (A) PCoA of bacteriophages grouped by host bacteria species in controls (n = 18), patients with AUD during active alcohol use (n = 62), and patients with AUD after abstinence from alcohol (n = 56). Axes represent the two most discriminating axes using the Bray‐Curtis distance metric. The p value was determined by permutational multivariate analysis of variance. (B) LDA of the sum of bacteriophages grouped by target bacteria species (sum) and individual bacteriophage species in patients with AUD during active alcohol use versus patients with AUD after abstinence from alcohol. (C–F) Relative abundance of bacteriophage species (C) Lactococcus phage PLgT1, (D) Leuconostoc phage phiLNTR2, (E) Leuconostoc phage phiLNTR3, and (F) Streptococcus phage 7201 in paired patients with AUD during active alcohol use versus abstinence. (G,H) Relative abundance of the sum of bacteriophages targeting bacteria species (G) Lactobacillus and (H) Propionibacterium in paired patients with AUD (n = 56). (I,J) Percentage of patients positive for bacteriophages targeting (I) Lactobacillus and (J) Propionibacterium bacteria in controls, patients with AUD actively using alcohol, and after abstinence. Abbreviations: AUD, alcohol use disorder; LDA, linear discriminant analysis; PC, principal component; (p), individual bacteriophage species; PCoA, principal coordinate analysis; var., variance