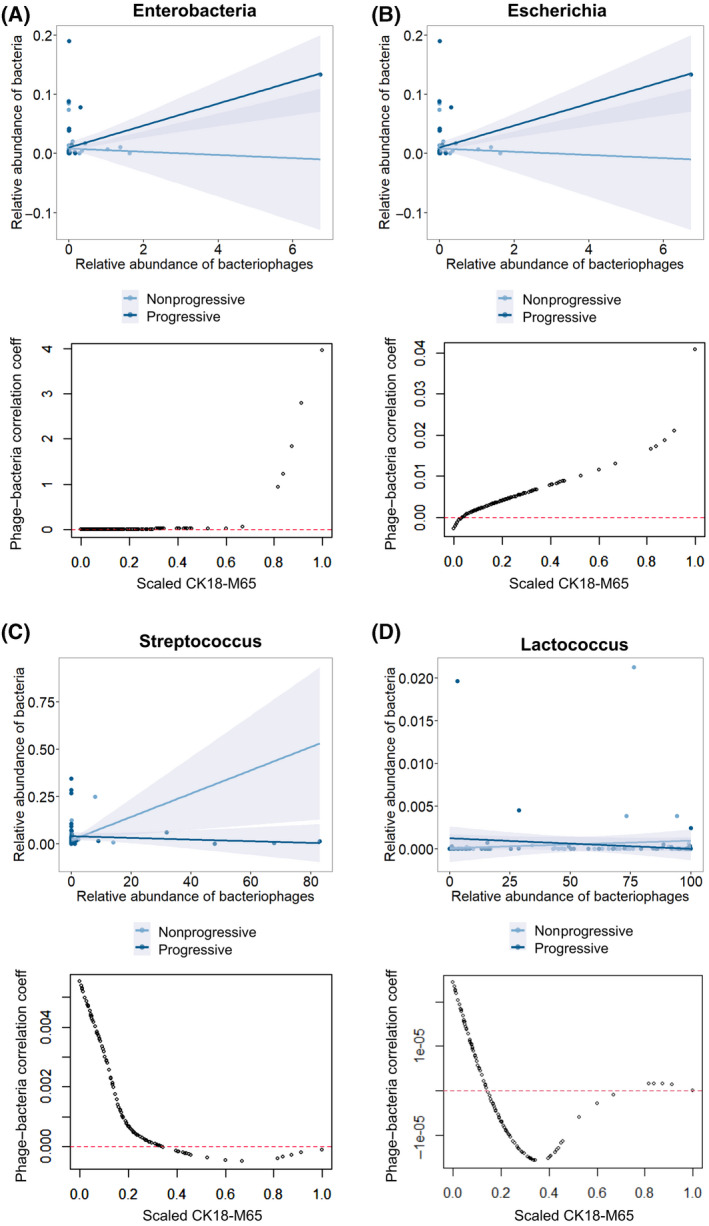
FIGURE 4.

Phage–host interactions in patients with AUD are affected by liver disease progression. (A–D) Plot of correlation analysis between relative abundance of bacteriophages grouped by target bacteria species versus their respective target bacteria (above) for patients with AUD with nonprogressive versus progressive liver disease. Below shows plot of correlation coefficients of the relative abundance of respective bacteriophages and their target bacteria against scaled measured CK18‐M65 for each patient with AUD. (A) Enterobacteria, (B) Escherichia, (C) Streptococcus, and (D) Lactococcus species. Abbreviations: AUD, alcohol use disorder; CK18‐M65, caspase‐cleaved and intact cytokeratin 18; coeff, coefficient
