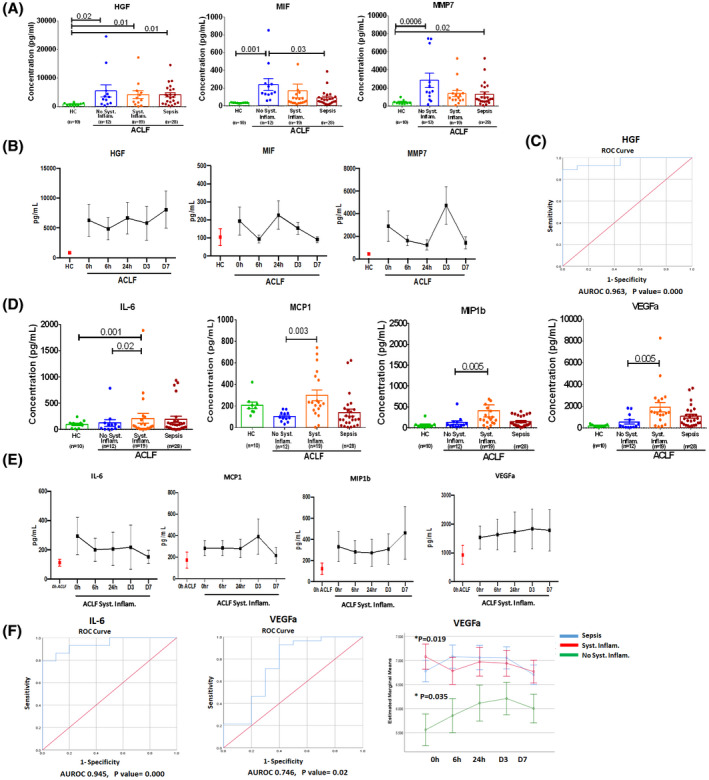
FIGURE 3.

Distinct pattern of soluble factors in patients with ACLF. (A) Dot plot graph represents concentrations of HGF, MIF, and MMP7 in plasma (pg/ml) in healthy controls (HC) and patients with ACLF (no systemic inflammation, systemic inflammation, and sepsis) at the time of admission. (B) Line plot represents the mean concentrations of HGF, MIF, and MMP7 in patients with ACLF but no systemic inflammation at 0 hour, 6 hours, 24 hours, day 3, and day 7. Red dot in graph represents mean concentration of analytes in HC to compare with patients with ACLF without systemic inflammation. (C) Receiver operating characteristic (ROC) curve for HGF values obtained from all patients with ACLF: area under the curve (AUC) = 0.963 (95% confidence interval [CI] = 0.735 to 1.0; p < 0.000). (D) Dot plot graph represents concentrations of IL‐6, monocyte chemoattractant protein 1 (MCP1), macrophage inflammatory protein 1 beta (MIP‐1b), vascular endothelial growth factor alpha (VEGFa) (pg/ml) in plasma of HC and patients with ACLF (no systemic inflammation, systemic inflammation, and sepsis) at the time of admission. (E) Line plot represents the mean concentrations of IL‐6, MCP1, VEGFa, and MIP‐1β in patients with ACLF systemic inflammation at 0 hour, 6 hours, 24 hours, day 3, and day 7. Red dot in graph represents mean concentration of soluble factor in patients with ACLF with no systemic inflammation. (F) ROC curve for IL‐6 and VEGFa; values obtained from all patients with ACLF systemic inflammation: AUC = 0.945 (95% CI = 0.89–1.0; p < 0.000) for IL‐6 and 0.746 (95% CI = 0.75–1.0; p < 0.02) for VEGFa. Line plot represents the mean concentrations of VEGFa in patients with ACLF systemic inflammation and sepsis at 0 hour, 6 hours, 24 hours, day 3, and day 7. Each data point in (A) and (D) represents an individual sample, and horizontal line represents the mean value. One‐way ANOVA and Kruskal‐Wallis test were performed for nonparametric data, respectively, and p < 0.05 was considered significant
