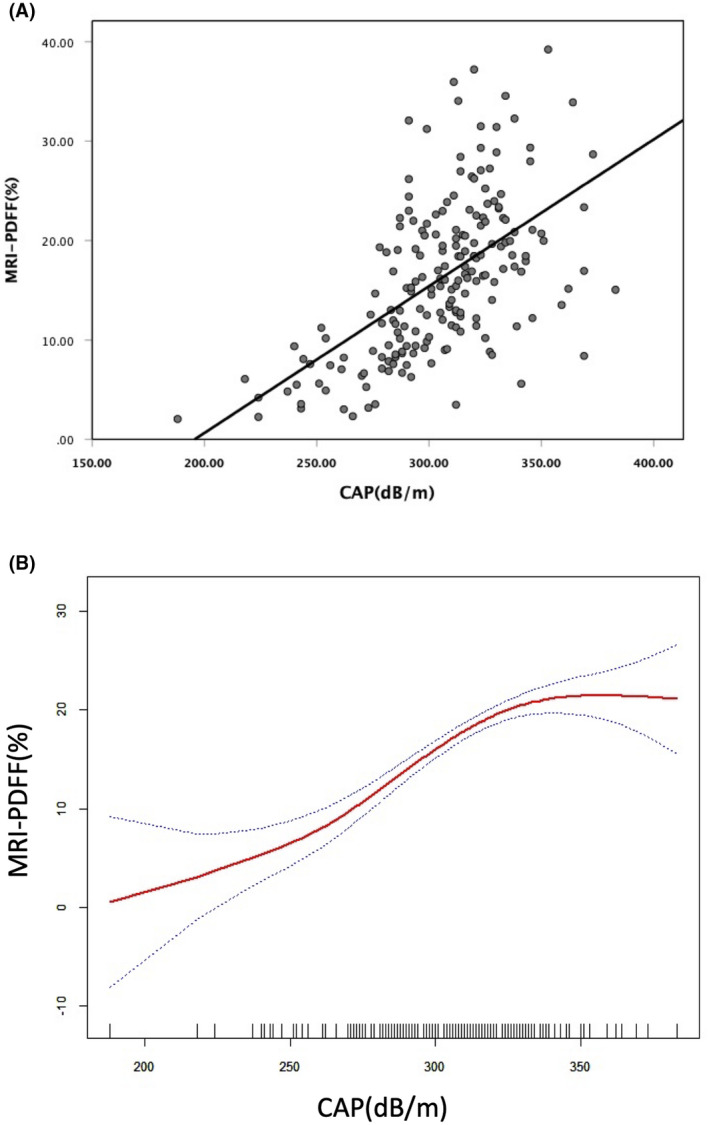
FIGURE 3.

MRI‐PDFF was correlated with CAP to evaluate the liver fat content. The plots of both (A) linear regression analysis and (B) piecewise linear regression analysis were presented. Abbreviations: CAP, controlled attenuated parameter; MRI‐PDFF, magnetic resonance imaging–proton density fat fraction
