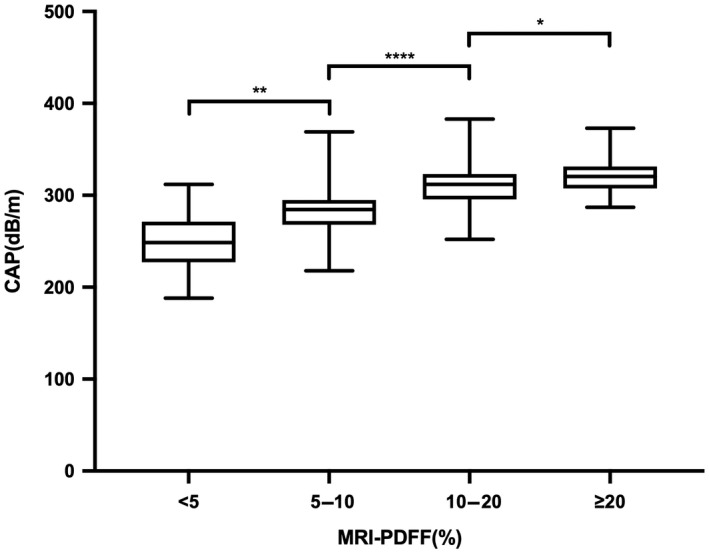
FIGURE 4.

Distribution of CAP measurements by liver fat content on MRI‐PDFF. CAP measurements increase with increasing liver fat content on MRI‐PDFF (t test *p < 0.05, **p < 0.01, ****p < 0.0001). Abbreviations: CAP, controlled attenuated parameter; MRI‐PDFF, magnetic resonance imaging–proton density fat fraction
