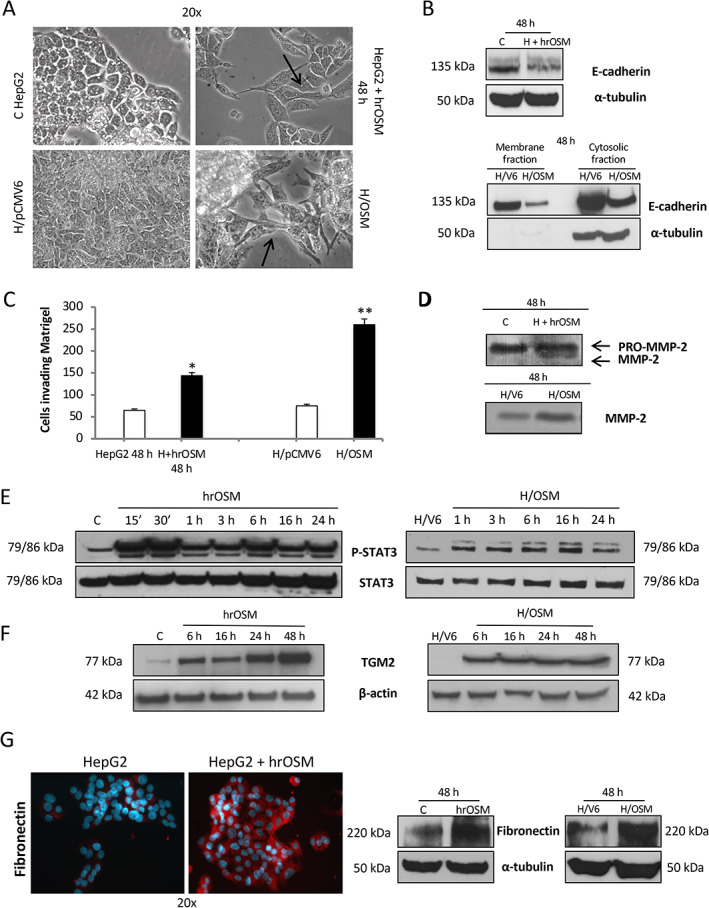
Figure 4.

OSM induces typical EMT changes and increased invasiveness. (A) Phase contrast analysis of morphological changes into fibroblastoid‐like morphology and cellular scatter of HepG2 naïve cells exposed to hrOSM for 48 h as well as in H/OSM cells. (B) Western blotting analysis of E‐cadherin expression in total extract obtained from HepG2 naïve cells exposed to hrOSM for 48 h or in membrane and cytosolic fraction extracts from H/OSM cells. Equal loading was evaluated by re‐probing membranes for α‐tubulin (for total extract and cytosolic fraction, respectively); samples from membrane extracts were evaluated for equal loading by staining with Ponceau S solution (data not shown). (C, D) Matrigel invasion assay using (C) Boyden chambers and (D) gelatin zymography assay for detection of matrix metalloproteinase‐2 (MMP‐2) performed on HepG2 naïve cells exposed to hrOSM for 48 h or on H/OSM. (E, F) Western blotting time course analysis of P‐STAT3 and TGM2 on total extracts obtained from HepG2 naïve cells exposed to hrOSM (left panel) or in H/OSM (right panel). Equal loading was evaluated by re‐probing membranes for total STAT3 and β‐actin. (G) Expression of fibronectin in HepG2 naïve cells exposed to hrOSM for 48 h or in H/OSM evaluated by indirect immunofluorescence staining (left panel) and quantified by western blotting analysis (right panel). Equal loading was evaluated by re‐probing membranes for α‐tubulin.
