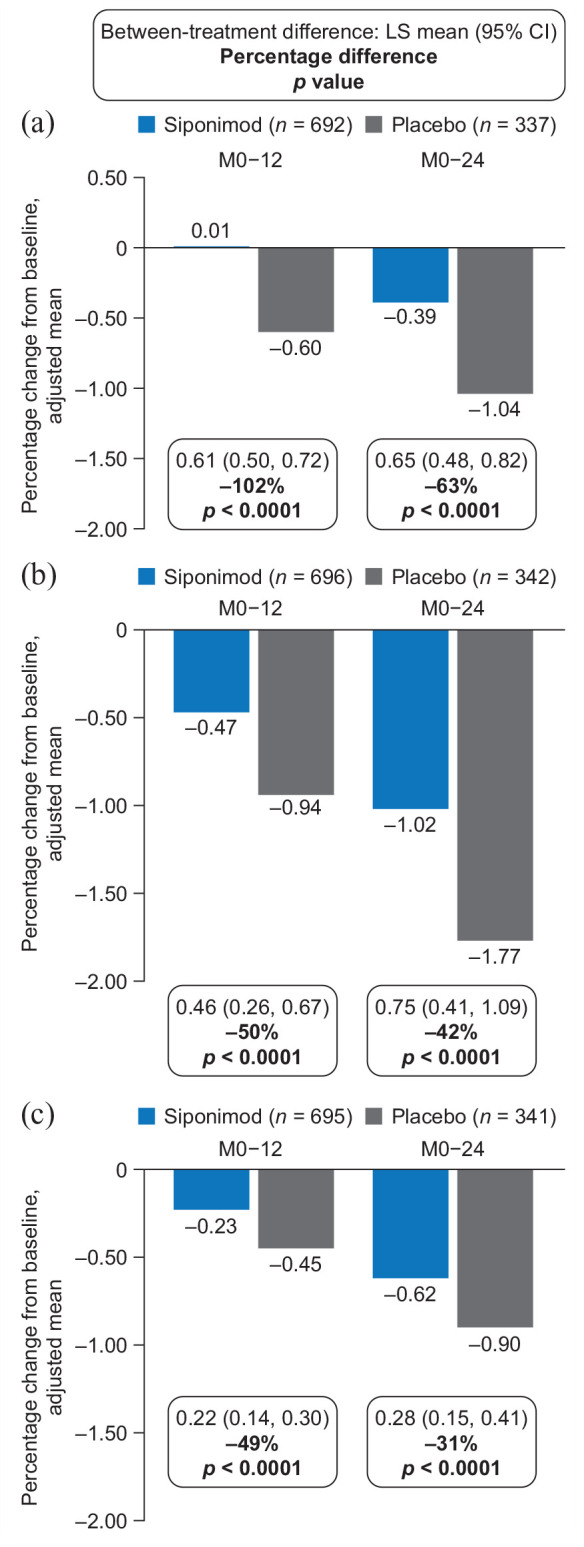
Figure 1.

Percentage change in volume of (a) cGM, (b) thalamus, and (c) total brain in the combined MRI cohort (PPSa).
cGM: cortical gray matter; CI: confidence interval; FAS: full analysis set; Gd+: gadolinium-enhancing; LS: least-squares; M, month; MMRM: multilevel model for repeated measures; MRI, magnetic resonance imaging; PPS: per-protocol set.
Percentage changes in brain structure volumes from baseline were analyzed using an MMRM adjusted for visit, treatment, baseline brain volume of a specific region, number of Gd+ T1 lesions at baseline, T2 lesion volume at baseline, treatment-by-visit interaction, and baseline total brain volume-by-visit interaction.
aPPS included all patients from the FAS who did not have any major protocol deviations that could confound interpretation.
