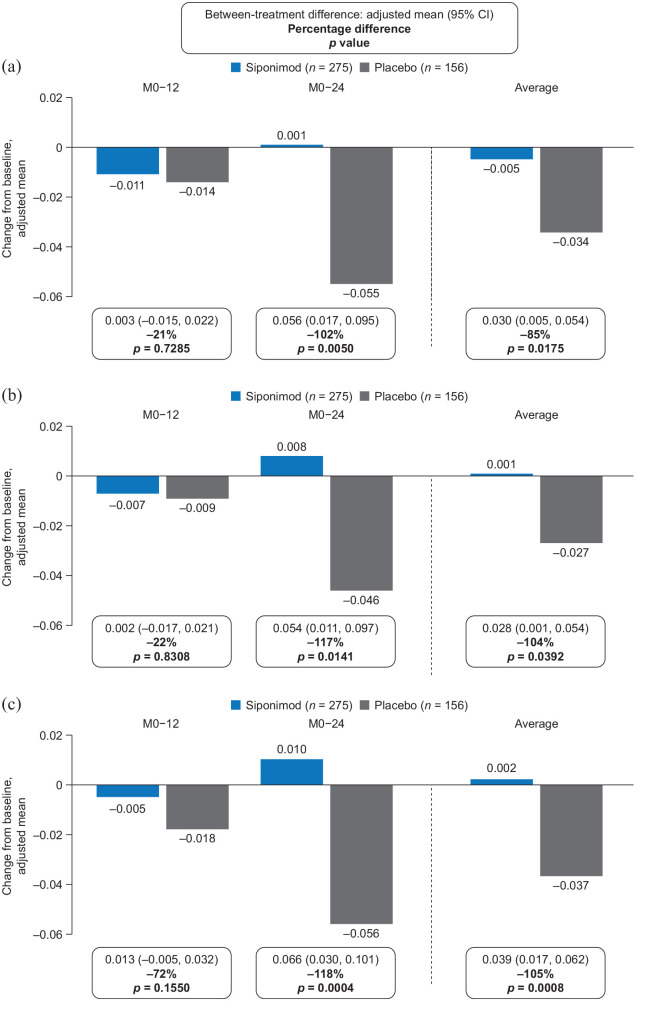
Figure 4.
Change from baseline to months 12 and 24 in median nMTRa in (a) NABT, (b) cGM, and (c) NAWM in the MTR subset (PPSb).
cGM: cortical gray matter; CI: confidence interval; FAS: full analysis set; M: month; MTR: magnetization transfer ratio; NABT: normal-appearing brain tissue; NAWM: normal-appearing white matter; nMTR: normalized magnetization transfer ratio; PPS: per-protocol set.
aVariations in MTR acquired on different scanners were reduced by MTR normalization, by setting the MTR of high-confidence cGM to 0 and of high-confidence white matter to 1 on the MTR scan of a healthy control individual on the same scanner.
bPPS included all patients from the FAS who did not have any major protocol deviations that could confound interpretation.

