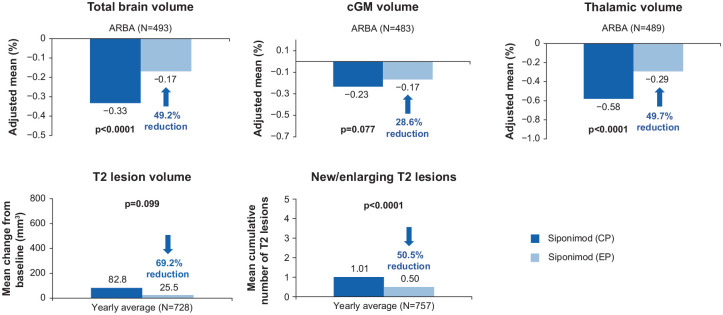
Figure 11.
Within-group comparison: MRI outcomes in the continuous siponimod group—overall population.
At each time point, only participants with a value both at the core part visit and the corresponding extension part visit are included; the yearly average is derived by standardizing the change to the last visit to 360 days; p-values from the Wilcoxon signed-rank test comparing percentage changes between the core part and the extension part within each group. ARBA is derived from percent change to last visit during the core part (median 21 months) and during the extension part (median 36 months).
CP: core part; EP: extension part; M: month.

