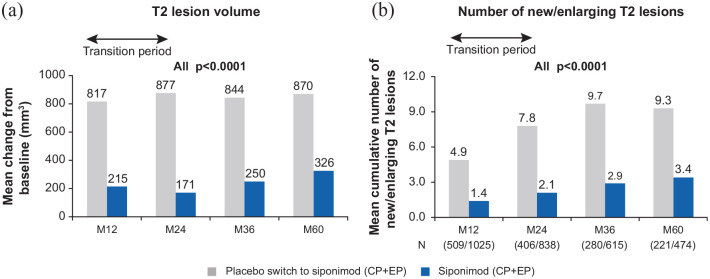
Figure 9.
Mean change from baseline during the study in T2 lesion volume and the cumulative number of new/enlarging T2 lesions (between-group comparison—overall population).
(a) Placebo switch to siponimod (N = 496); siponimod (N = 999). MMRM model: percentage change from baseline adjusted for visit, treatment, age, number of Gd+ T1 lesions at baseline, T2 lesion volume (mm3) at baseline, superimposed relapses at baseline, visit by treatment interaction (and baseline normalized brain tissue volume, where applicable) and (b) p-values from the Wilcoxon signed-rank test for the differences between treatment groups.
CP: core part; EP: extension part; Gd+: gadolinium-enhancing; M: month.

