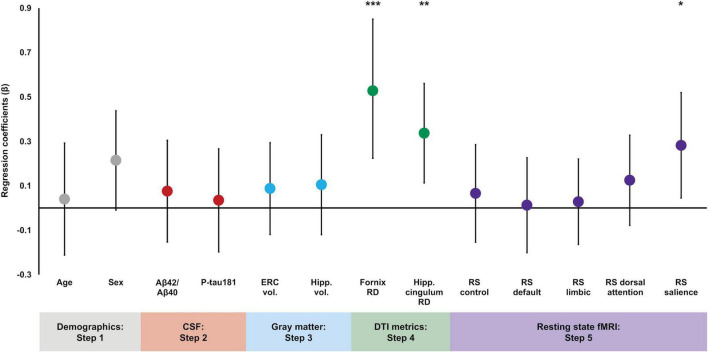
FIGURE 1.
Regression coefficient betas (absolute values) from the hierarchical linear regression plotted for variables of interest color coded based on entry into the regression. Error bars are 95% confidence intervals. Demographic variables were entered in Step 1, CSF measures were entered in Step 2, gray matter volumes were entered in Step 3, DTI measures were entered in Step 4, and functional connectivity measures were entered in Step 5. Fornix RD, hippocampal cingulum RD, and salience network resting state connectivity were significant predictors of delayed episodic memory performance. *p < 0.05; **p < 0.01; ***p < 0.001.

