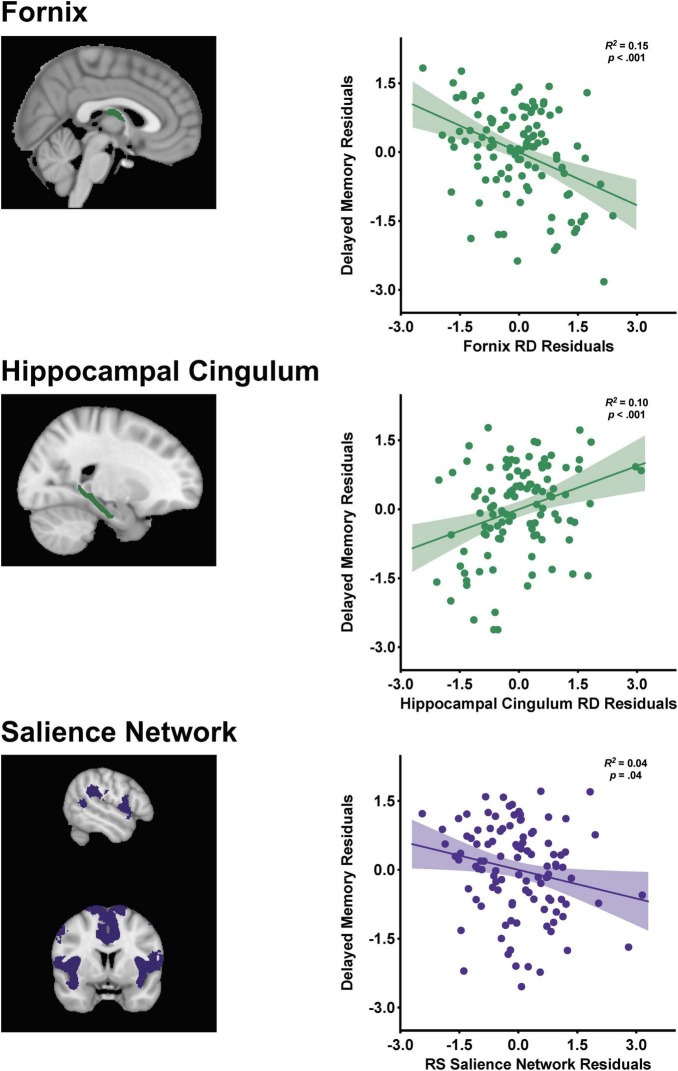
FIGURE 2.
Visualization of the fornix [restricted to the body and column due to resolution constraints], hippocampal cingulum, and salience network with corresponding partial regression plots from the stepwise linear regression with standardized residuals depicting the relationships between the structural and functional connectivity markers with delayed episodic memory performance. Shaded 95% confidence interval bands.

