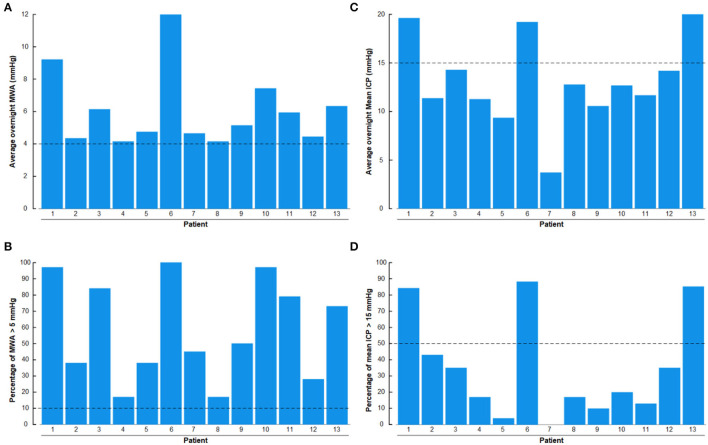
Figure 11.
The overnight recordings of MWA and mean ICP in the 13 Patients with IIH included in the study are shown on an individual basis. (A) Overnight average of MWA. (B) Overnight percentage of MWA > 5 mmHg. (C) Overnight average of mean ICP. (D) Overnight percentage of mean ICP > 15 mmHg. The horizontal lines indicate upper normal thresholds as defined by the first author: (A) Overnight MWA > 4 mmHg. (B) Overnight 10% of MWA > 5 mmHg. (C) Overnight Mean ICP > 15 mmHg. (D) Overnight 50% of Mean ICP > 15 mmHg.

