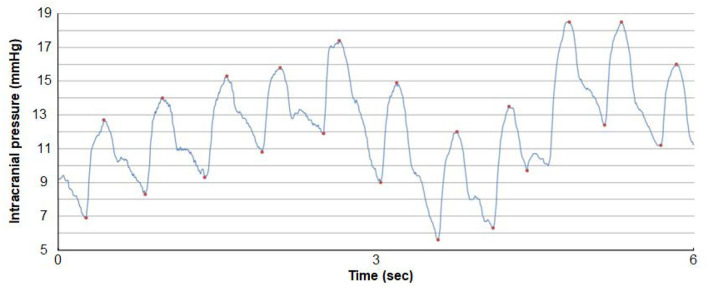
Figure 3.
A continuous ICP signal measured from an ICP sensor placed in the frontal parenchyma of an individual with IIH. The level of ICP is shown on the y-axis and time on the x-axis. Both the pulsatile and static ICP are derived from the same ICP signal. The pulsatile ICP is described as the Mean Wave Amplitude (MWA) that refers to the pressure changes occurring during the cardiac cycle, that is, the increase in pressure from diastolic minimum pressure to systolic maximum pressure (here illustrated by the red dots). The mean ICP refers to the static ICP, that is, the absolute pressure measured against a reference pressure. The MWA and the mean ICP are determined over consecutive 6-s time windows; here mean ICP is 12.2 mmHg and MWA 6.4 mmHg. Image: Sensometrics Analytics, dPCom, Oslo, Norway.

