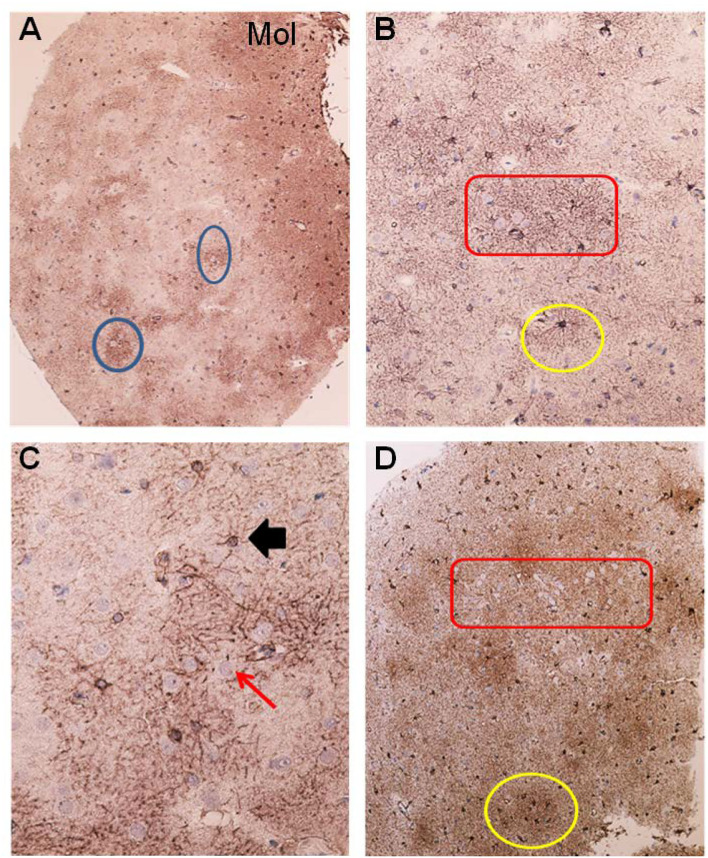
Figure 4.
Astrocytes visualized by GFAP IR in brain cortex biopsies from IIH patients. (A) Low magnification of a section of brain biopsy reveals a high prevalence of astrocytes in the subpial molecular layer (Mol; layer 1, also named Chaslin's layer) looking like clusters of dark dots. Patches of astrocytes enclosing neurons are seen in cortical layers 2/3 (blue circles). (B) Clusters of hypertrophic astrocytes are seen enclosing unstained neurons (encircled by a red line). An apparently normal-looking astrocyte (outlined by yellow circle) with radiating slender processes without having any processes from adjacent glial cells entering its domain. (C) Neurons (red arrow) in the center of the specimen are enclosed by astrocytes. Note that processes from adjacent astrocytes enter their neighbors' domains as well as having increased branching (black arrow). The GFAP-IR expression is low outside the patch of neurons and astrocytes. (D) A low magnification micrograph of the superficial cortex layers shows a cluster of neurons forming a patch surrounded by mainly glia cells (encircled by a red line). Adjacent cluster of astrocytes enclose only few neurons (yellow circle).

