
FIGURE 9.
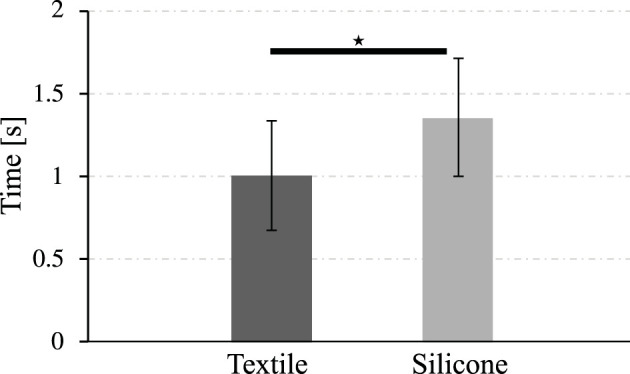
Time required by the actuators to reach full bending position. The symbol ⋆ represents a significant difference between the two groups based on statistical analysis tests (p < 0.05).
Official websites use .gov
A
.gov website belongs to an official
government organization in the United States.
Secure .gov websites use HTTPS
A lock (
) or https:// means you've safely
connected to the .gov website. Share sensitive
information only on official, secure websites.
Time required by the actuators to reach full bending position. The symbol ⋆ represents a significant difference between the two groups based on statistical analysis tests (p < 0.05).