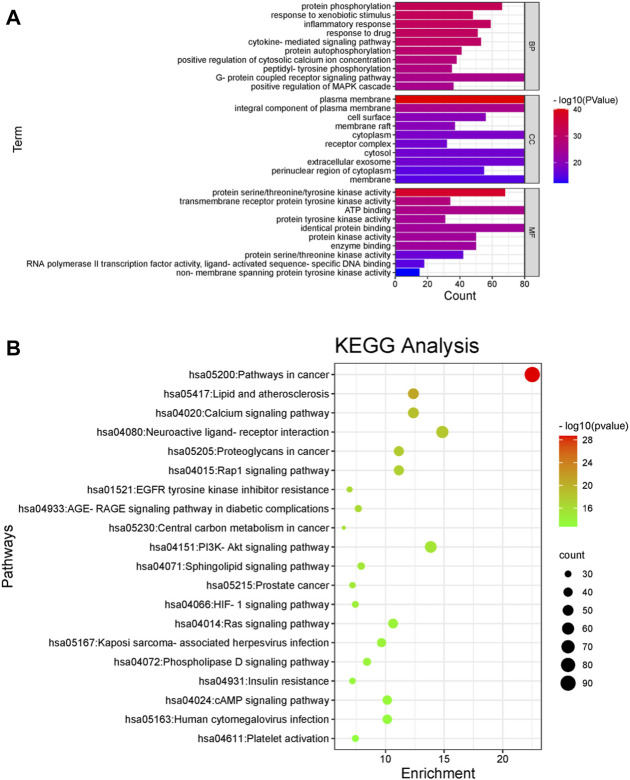
FIGURE 3.
GO analyses and KEGG pathway enrichment analyses of the gene symbols associated with sepsis. (A) GO analyses of the gene symbols associated with sepsis. The x-axis represents significant enrichment in the counts of these terms. The y-axis represents the categories in the GO of the target genes (p < 0.05). The abscissa represents the number of targets; the left represents BP, CC and MF; the color represents p-value; the smaller the p-value, the redder the color is; the larger the p-value, the bluer it is. (B) KEGG pathway enrichment analyses of the gene symbols associated with sepsis. The x-axis represents the counts of the target symbols in each pathway; the y-axis represents the main pathways (p < 0.05). The abscissa represents the number of enriched genes, the left represents the name of pathway, and the color represents the p-value. The smaller the p-value, the more red the color is; the larger the p-value, the more green the color is.

