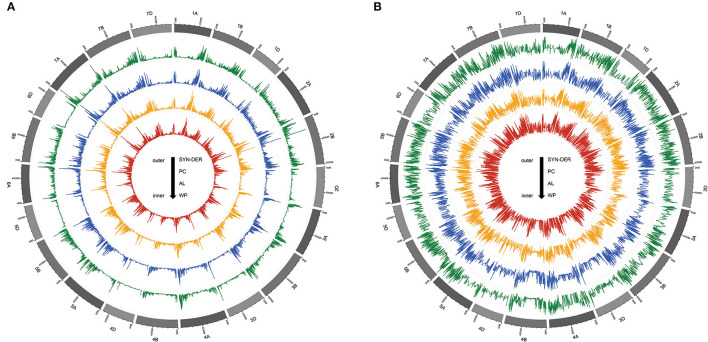
Figure 2.
The Circos plot, from outside to inside, illustrates the patterns of nucleotide diversity (A) and Tajima'D (B) values in synthetic-derived wheats (SYN-DER), commercially released Pakistan cultivars (PC), and advanced breeding lines (AL), respectively. Nucleotide diversity and Tajima'D are plotted along reference chromosomes in sliding windows of 1,000 kb with a step size of 100 kb.

