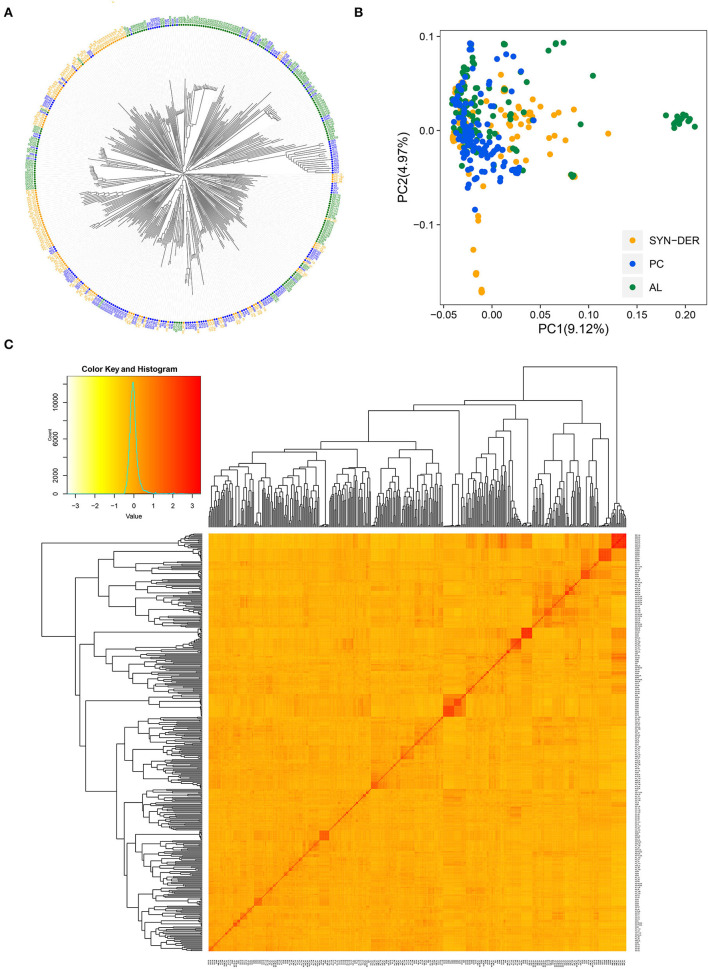
Figure 3.
Population structure and diversity analysis of 422 wheat accessions using 18,589 high-quality SNPs. (A) Neighbor-joining (NJ) tree, (B) principal component analysis (PCA) plot, and (C) heat map of pairwise kinship matrix with the tree shown on the top and left. The SYN-DER indicates synthetic-derived wheats; PC, commercially released Pakistan cultivars; AL, advanced breeding lines.

