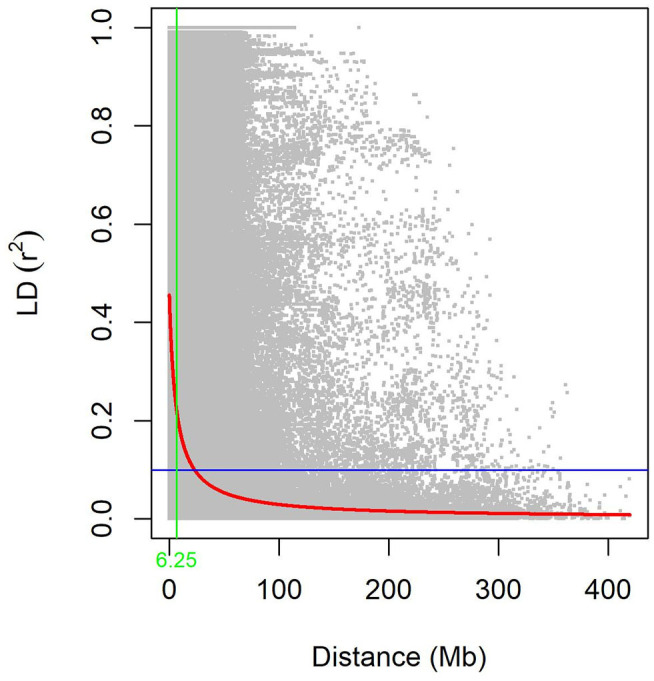
Figure 4.

The decay of linkage disequilibrium (LD) in the whole population (WP). Pairwise LD (r2) values plotted vs. corresponding pairwise physical distance (Mb) of GBS-SNPs. The trend line of non-linear regressions against physical distance is given by the red line. The horizontal and vertical lines represent the critical value of r2 (0.1) and LD decay values, respectively.
