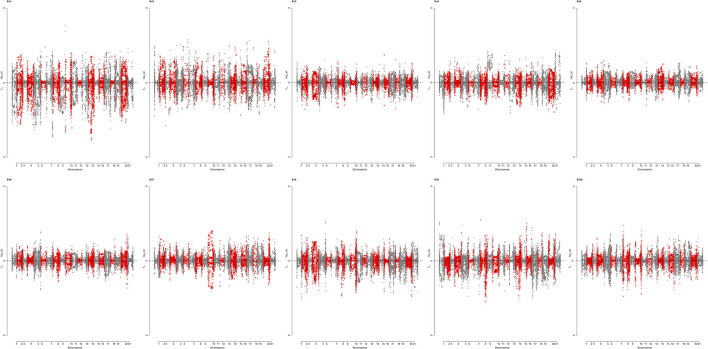
Figure 5.
Miami plot showing loci under selection identified by EigenGWAS (upper for PGC and lower for FST) for top 10 eigenvectors (EV) based on 422 wheat accessions. PGC is the p corrected by lamdaGC in EigenGWAS. EV1-EV10 were the first 10 eigenvectors, each of which was used as phenotype for EigenGWAS analysis.

