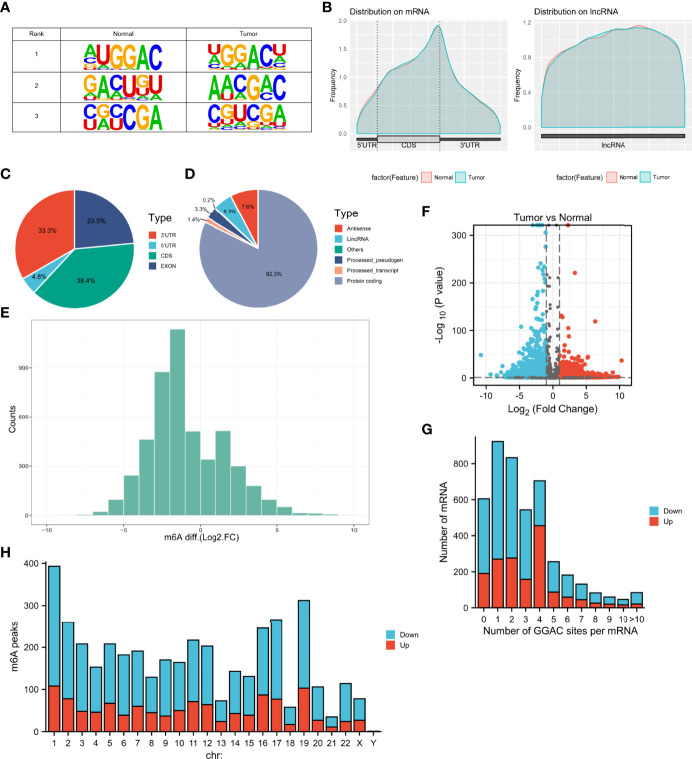
Figure 1.
Characteristics of m6A methylation in LUAD. (A) The sequence logo showed the top three m6A motifs. (B) The distribution of m6A peaks in normal and tumor tissues. (C, D) Pie charts showing the distribution of differently methylated m6A peaks. (E) Histogram showing the changes in m6A enrichment between normal and tumor samples. (F) Volcano plots show significantly different m6A peaks. (G) The distribution of altered GGAC sequence per mRNA. (H) The distribution of differentially methylated m6A peaks in human chromosomes. Fold change ≥ 2 and P < 0.05.

