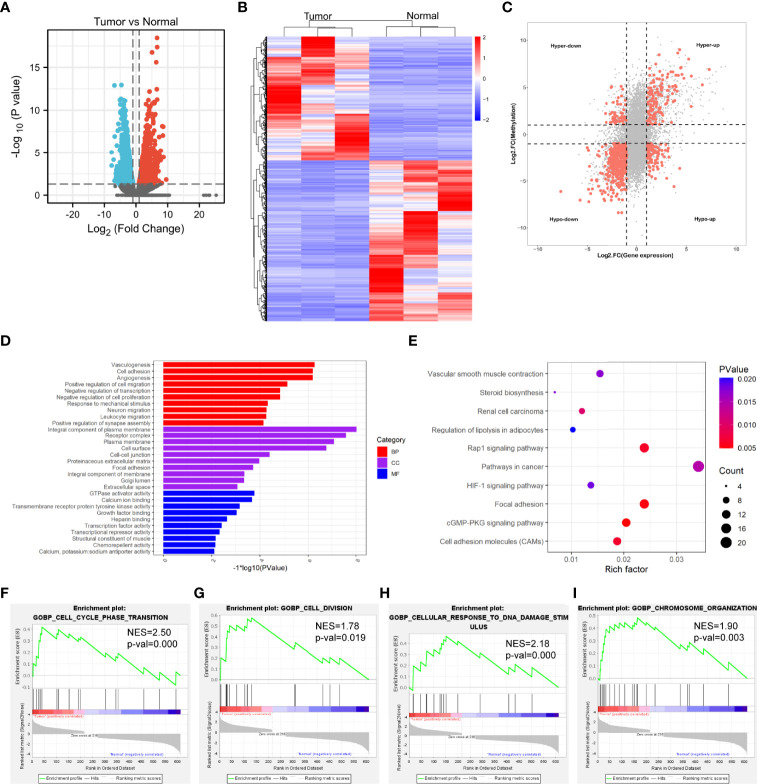
Figure 4.
Conjoint analysis of MeRIP-seq and RNA-seq data. (A) Volcano plots showing the differentially expressed genes in tumor vs normal. (B) Heatmap plots showing the differentially expressed genes in tumor vs normal. (C) Four-quadrant plots showing the distribution of genes with significant changes in both the m6A modification and RNA levels. (D) The top 10 GO terms of genes with significant changes in both the m6A modification and mRNA levels. (E) The top 10 KEGG pathways of genes with significant changes in both the m6A modification and RNA levels. (F, G, H, I) GSEA enrichment of genes with significant changes in both the m6A modification and RNA levels.

