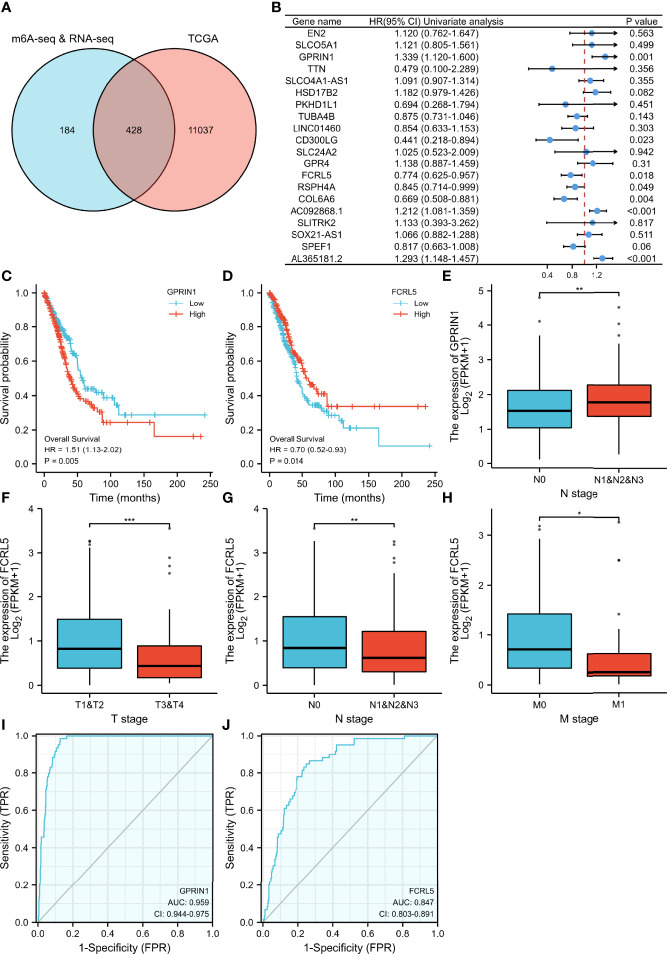
Figure 5.
The relationship between gene expression regulated by m6A modification and clinical parameters in the TCGA database. (A) The intersection of genes in our study and TCGA database. (B) 20 prognostic genes were identified via univariate Cox regression analysis. (C, D) Overall survival curves of GPRIN1 and FCRL5, respectively. (E)The relationships between GPRIN1 expression and N. (F, G, H) The relationships between FCRL5 expression and M, N, and clinical stage. (I, J) The ROC curves of GPRIN1 and FCRL5, respectively. P*<0.5, P**<0.01, P***<0.001. (N: lymph node metastasis; M: distant metastasis.).

