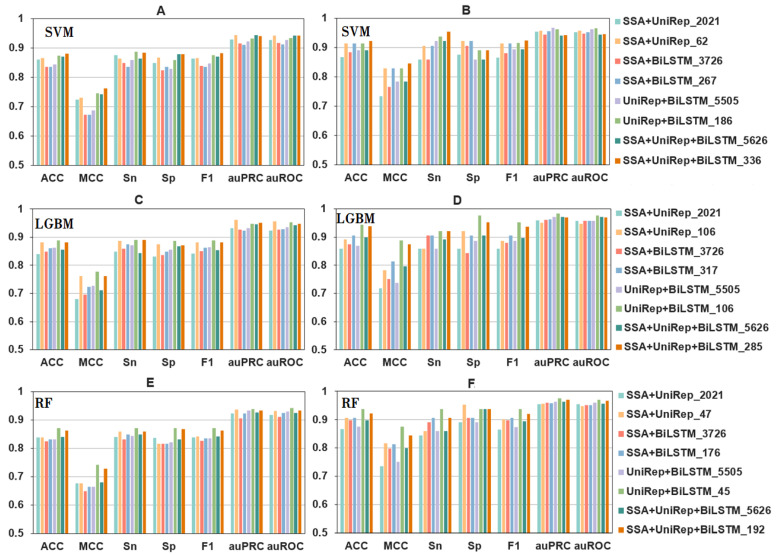
Figure 3.
The performance metrics of fusion features using a range of selected features and different algorithms. Panels (A,C,E) show 10-fold cross-validation results, and panels (B,D,F) are independent test results. Please note that the same colors represent different selected features in the different panels. Refer to the codes directly underneath a panel for the appropriately selected feature/model combination codes.

