Figure 2.
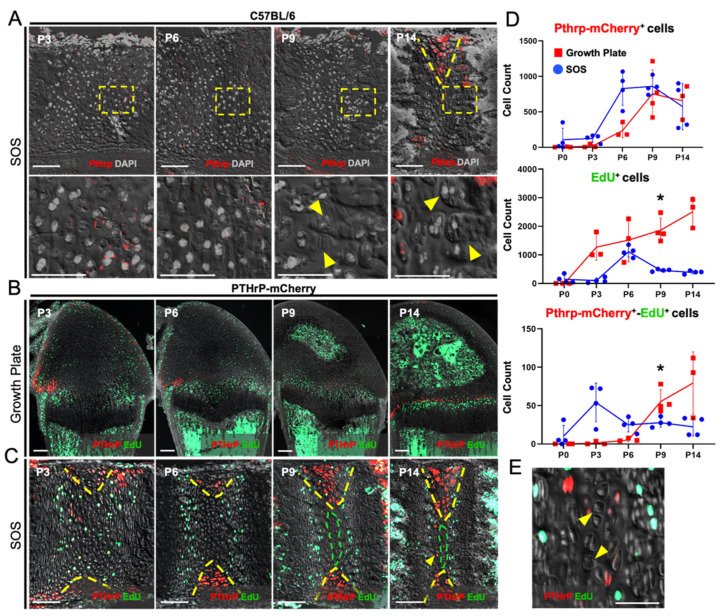
PTHrP expression is confined to the lateral wedge-shaped area of the synchondrosis. (A, Upper panels) RNAScope in situ hybridization assays for endogenous Pthrp mRNAs in early postnatal development. (A, Lower panels) 40× magnified images of transition zones between resting, proliferating, and hypertrophic chondrocytes. (B,C) Pthrp-mCherry knock-in reporter activities and EdU-labeling in femoral growth plate (B) and spheno-occipital synchondrosis (SOS) (C). Red: Pthrp-Opal 570 (A), Pthrp-mCherry (B,C), gray: DAPI (A) DIC (B,C). Scale bars: 100 μm. (D) Quantification of Pthrp-mCherry+ (Upper), EdU+ (Middle) and Pthrp-mCherry+-EdU+ (Bottom) chondrocytes. n = 3/4 of each group/timepoint. * p < 0.05, one-way ANOVA followed by the Mann–Whitney U test. Data are present as the mean ± SD. (E) 40× magnification of central hypertrophic zone in P14 SOS. (A,C) Yellow dashed wedges: PTHrP-mCherry expression domain restricted to the lateral wedge-shaped areas, (A, lower center panel) arrowheads: proliferating columns, (A, lower right panel) arrowheads: hypertrophic chondrocytes, (C) green dashed lines: presumptive central hypertrophic zone, (E) arrowheads: presumptive central hypertrophic chondrocytes.

