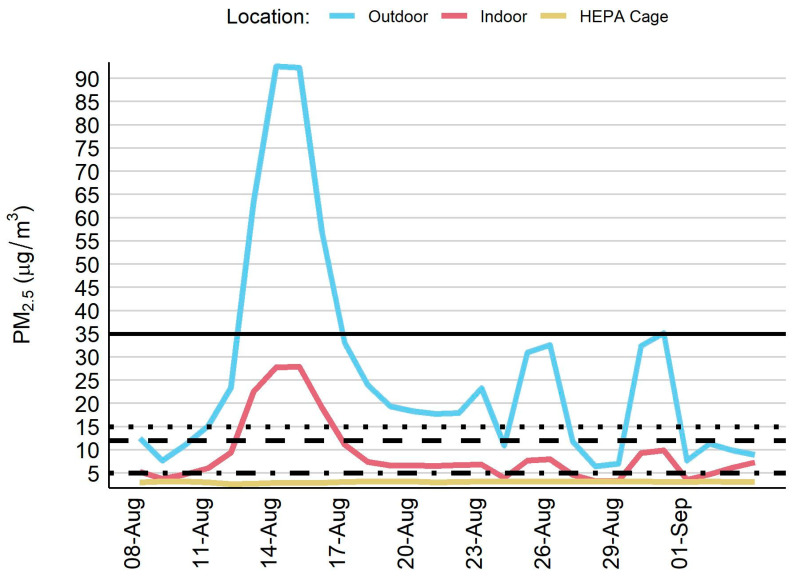
Figure 3.
Time series plot for fine particulate matter across three sampling locations. PM2.5 = fine particulate matter. Horizontal lines indicate PM2.5 thresholds: United State Environmental Protection Agency–24-h standard of 35 µg/m3 (solid line) and annual mean of 12 µg/m3 (long dashes); World Health Organization–24-h guideline of 15 µg/m3 (short dashes) and annual mean of 5 µg/m3 (alternating short/long dashes).

