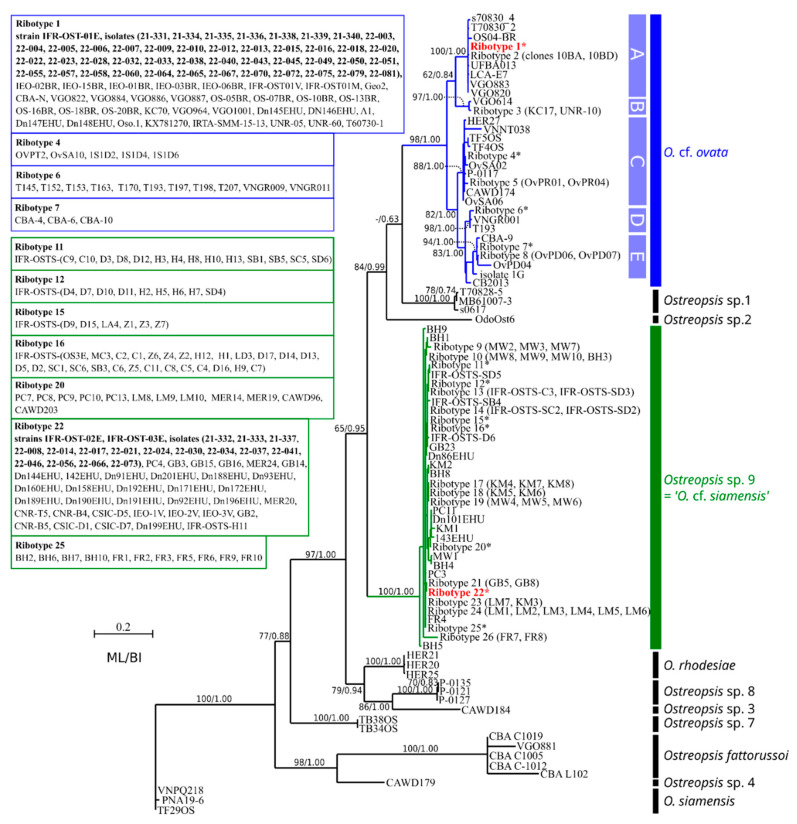
Figure 8.
Maximum-likelihood phylogenetic tree inferred from ITS region sequences of various Ostreopsis strains and field specimens (88 sequences, 693 sites). Identical sequences are considered to belong to a single ribotype (the list of all sequences used in the analysis is given in Supplementary Table S1). * indicates ribotypes for which sequences are listed in boxes on the left. A–E correspond to subclades in Ostreopsis cf. ovata clade. Sequences acquired in this study are in bold face. Numbers at nodes indicate bootstrap values (in ML analysis) and posterior probabilities (Bayesian inference). Bootstrap values below 65 are indicated by ‘-’.

