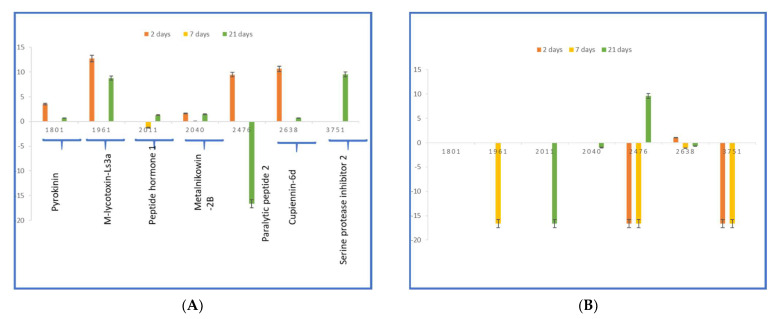
Figure 6.
The ratio for the intensity after 2, 7, and 21 days of PND exposure relative to the control is depicted on the y-axis as a log2 ratio to clearly see up/downregulation of peptides relative to the x-axis. Panel (A,B) show up/downregulation of peptides for female and male groups, respectively. The error bars denote the standard error of the mean (n = 3).

