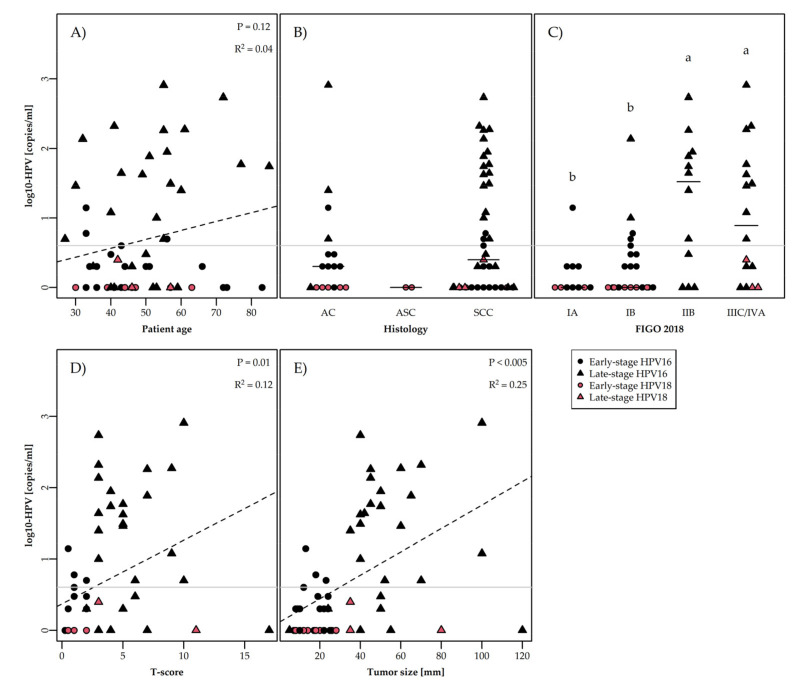
Figure 3.
Concentration (copies/mL) of ccfHPV DNA (log scale) detected by ddPCR in cervical cancer patients according to clinical and biological criteria. Statistical significance was tested using the Kruskall–Wallis test followed by Conover–Iman for (B,C) and linear regression for (A,D,E). Grey line represents cutoff value for ccfHPV DNA positivity (>3 copies/mL). In (C), different letters (a,b) denote statistical difference between two groups, whereas the same letters (a, a or b, b) denote no statistical difference between two groups. In (B,C), black lines represent median values. (A) Concentration by patient age. (B) Concentration by histology (AC = adenocarcinomas, ASC = adenosquamous carcinoma, SCC = squamous cell carcinoma). (C): Concentration by FIGO 2018 stage (IA = IA1 and IA2, IB = IB1, IB2, and IB3, and IIIC/IVA = IIIC1, IIIC2, and IVA). (D) Concentration by tumor score (T score)1. (E) Concentration by tumor size (mm). T score was evaluated with the TS system presented in Table 1 in Lindegaard, J.C., et al. (see ref [46]).

