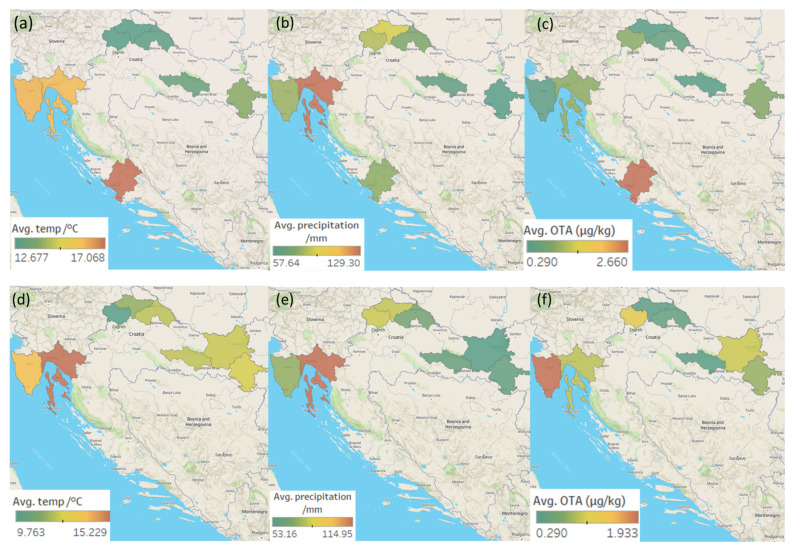
Figure 2.
Maps representing the regional weather and average OTA concentrations in the five Croatian production regions of traditional meat products in the 1st sampling year (ripening: 2019—the first half of 2020): (a) average temperatures, (b) average precipitation; (c) average OTA concentrations in positive samples. Regional weather and average OTA concentrations in the 2nd sampling year (ripening: 2020—the first half of 2021): (d) average temperatures; (e) average precipitation; (f) average OTA concentrations in positive samples.

