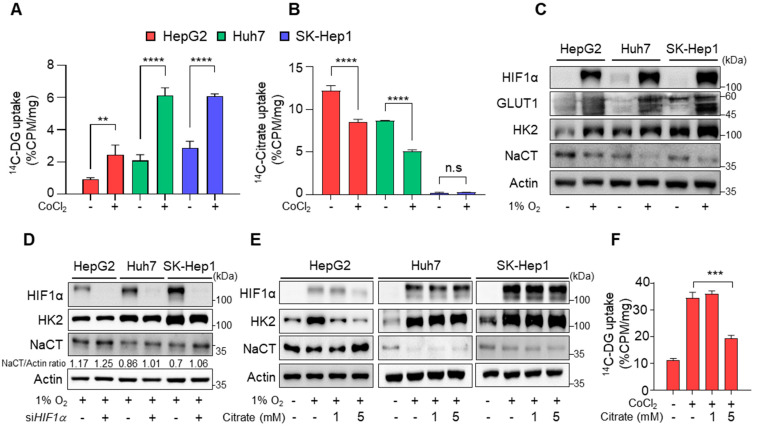
Figure 2.
Reduction of glycolysis after citrate treatment. (A,B) In vitro 14C-DG uptake (A) and 14C-citrate (B) in HCC cells after incubation with or without 100 μM CoCl2. (C) The expression of HIF1α, GLUT1, HK2, NaCT, and β-actin in HCC cells after 24 h incubation under 21% or 1% O2. (D) HIF1α, HK2, NaCT, and β-actin expression levels in HCC cells after transfection with siRNA oligos against HIF1α (siHIF1α) or scrambled siRNA oligos for 24 h under 1% O2 conditions. (E) HIF1α, HK2, NaCT, and β-actin expression levels in HCC cells after treatment with the indicated condition for 24 h. (F) In vitro 14C-DG uptake in HepG2 cells after the indicated treatment. Data were represented as mean ± SEM and were compared using unpaired two-tailed t-tests and one-way ANOVA tests. ** p < 0.01, *** p < 0.001, **** p < 0.0001; n.s, not significant. Full Western Blot images can be found in Figure S9.

