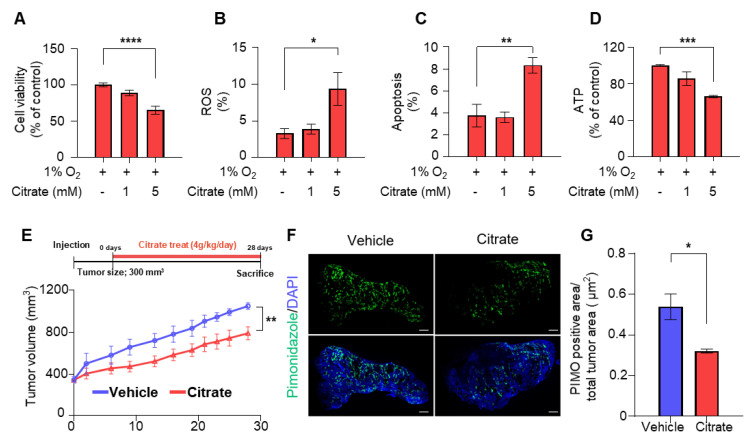
Figure 4.
Anti-tumor effect of citrate in vitro and in vivo studies. (A) Cell viability in HepG2 cells following indicated treatment under 1% O2 for 24 h. (B) ROS production was measured by flow cytometry using MitoSOX staining in HepG2 cells following treatment with the same as (A). (C) Rates of apoptosis (%) counted by flow cytometry following staining with Annexin V-fluorescein isothiocyanate and PI in HepG2 cells after treatment with the same as (A). (D) ATP levels in HepG2 cells after treatment with the same as (A). (E) The average tumor volumes of mice receiving drinking water supplemented with vehicle (n = 5) or citrate (4 g/kg/day, n = 6) for 28 days. (F) Representative images of immunofluorescence staining with pimonidazole. (G) Quantification of the percentage of pimonidazole-positive area from vehicle (n = 4) or citrate-treated (n = 4) mice. Data represented as mean ± SEM and were compared using unpaired two-tailed t-tests and one-way ANOVA tests. * p < 0.05, ** p < 0.01, *** p < 0.001, **** p < 0.0001.

