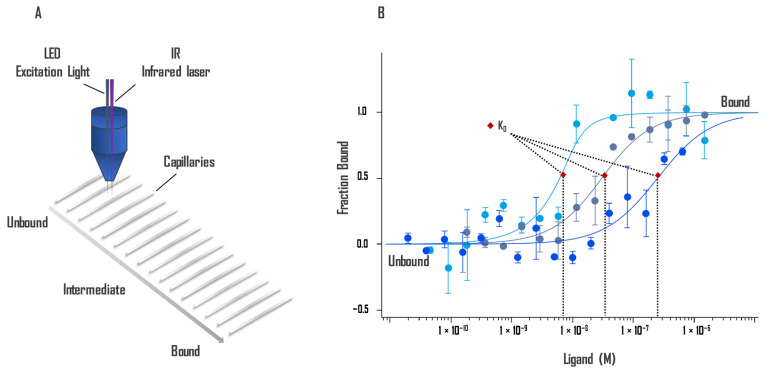
Figure 2.
(A) Schematic representation of the optical system. Fluorescent molecules in the 16 capillaries are excited and the fluorescence detected by the same objective. An IR laser heats up locally, and thermophoresis of the fluorescent molecules across the temperature gradient is detected. (B) The intensity of fluorescence changes due to the movement of molecules away from the heated area differs when the ligand is bound. A binding curve can be established from difference of thermophoresis between the fluorescent molecules of both unbound and bound states against the ligand concentration. Binding constants Kd can be derived from binding curves. Graphs are represented as fraction bound against ligand concentration. Data represent three independent experiments and were fitted to a Kd binding model assuming a 1:1 binding stoichiometry.

