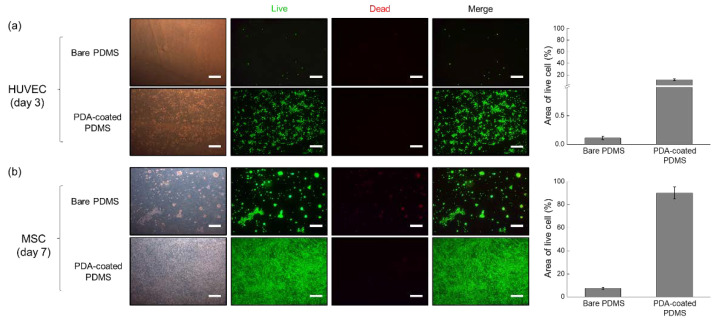
Figure 5.
Results of the live/dead cell assays performed on HUVECs and MSCs cultured on bare and PDA-coated PDMS surfaces. The percentage of the area occupied by live cells was calculated using the ImageJ software. (a) HUVECs were cultured for 3 days and (b) MSCs were cultured for 7 days. Scale bar = 500 μm.

