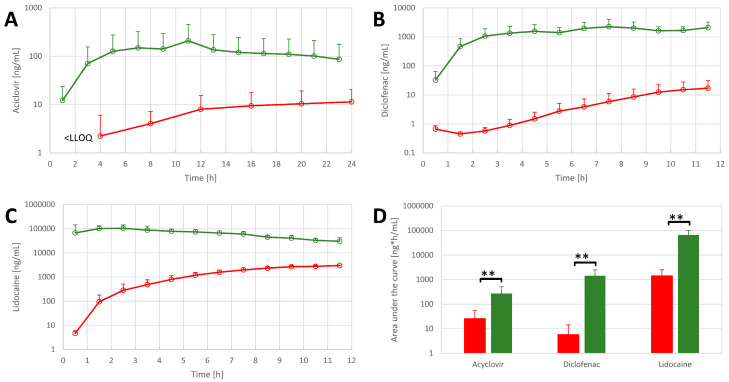
Figure 6.
API concentrations in OFM samples from FTSE (n = 3, green) and skin explants (n = 4, red) for (A) acyclovir, (B) diclofenac, and (C) lidocaine. (D) Comparison of the total concentration of APIs in OFM samples in FTSE (green bars) and skin explants (red bars). Data are shown as the mean and SD (only upward error bars are shown for readability). ** p ≤ 0.01.

