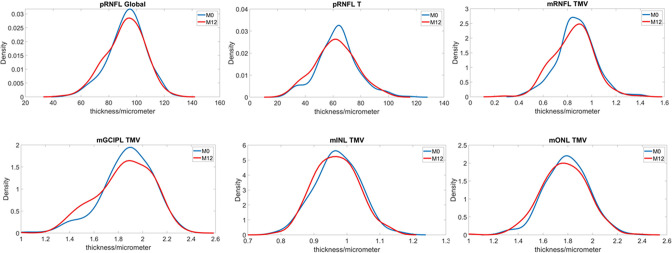
Figure 2.
Comparison of retinal thickness between M0 and M12. The line graph shows the changes in the distribution of different retinal layers between M0 and M12. X axis represents retinal measures (micrometre for thickness, cubic micrometre for volume). Y axis is the probability density. mGCIPL, macular ganglion cell inner plexiform complex; mINL, macular inner nuclear layer; mONL, macular outer nuclear layer; mRNFL, macular nerve fibre layer; pRNFL, peripapillary nerve fibre layer. TMV, total macular volume

